Intro to Jmeter
October 12, 2020
Background
Briefly, performance testing tells you the speed and reliablity of your system when under different load conditions. It is great for identifying bottlenecks in your system, failure points, and nuanced issues that may only show up during peak load. There are many types of performance tests but this article will focus on setting up a basic http speed test with Jmeter. Further articles may do a deeper dive.
Installing Jmeter
Jmeter is a java application, and as such needs java 8+ installed. Make sure you have java installed (you can use openJDK or Amazon Correto) and set the JAVA_HOME environment variable to point to your installation.
Installing Jmeter on Linux is as easy as downloading the latest binary zip, extracting and running the jmeter.sh (Mac/Linux) or jmeter.cmd (Windows).
My preferred way though is to use homebrew (Mac/Linux)
brew install jmeter
First Jmeter Script
Open up Jmeter by running the command jmeter in the terminal.
Create a New Test By Adding a Thread Group
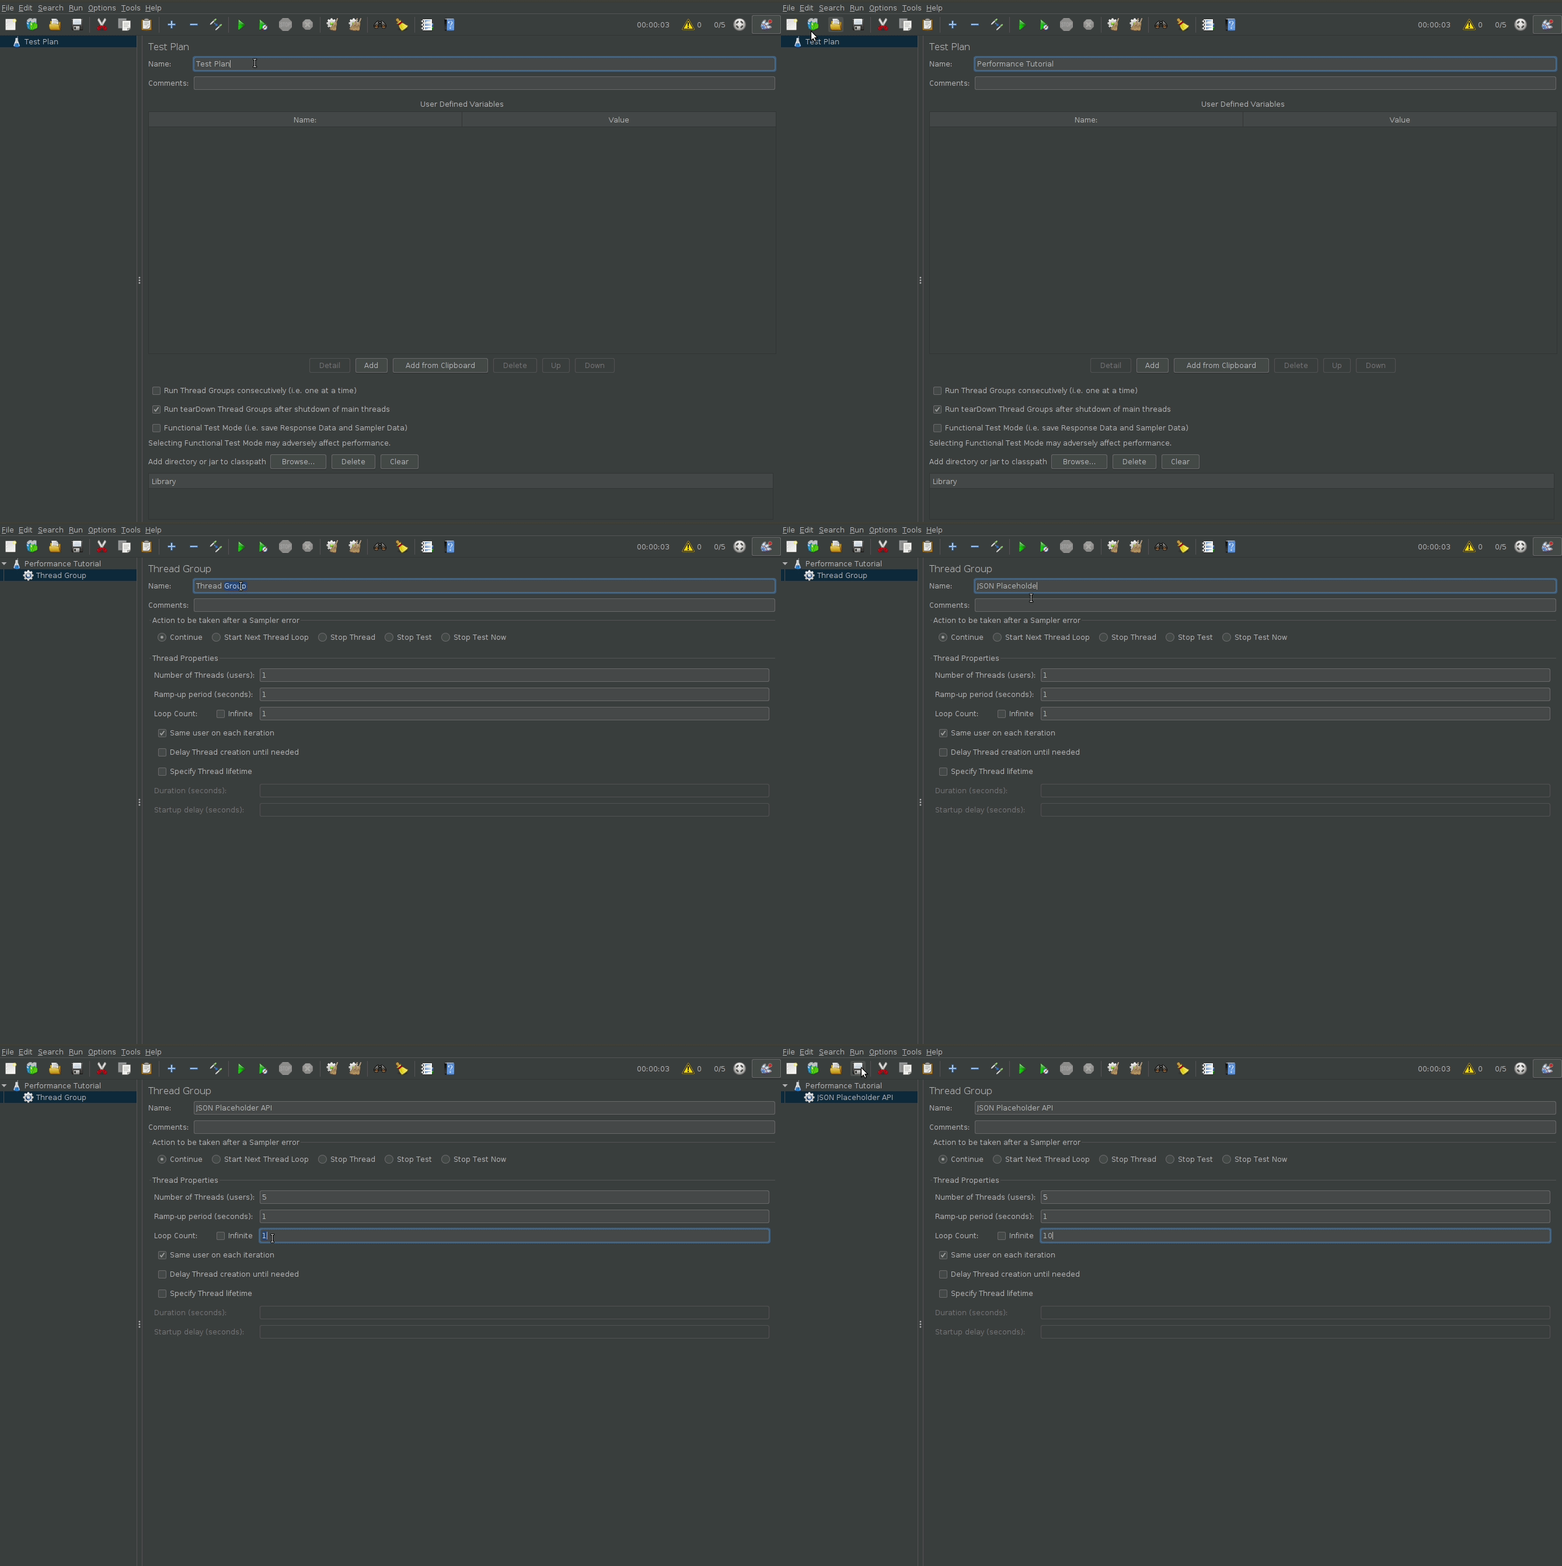
Right Click on “Test Plan”, and add a new thread group. The thread group simulates users, or the load on your system.
Add an HTTP Request
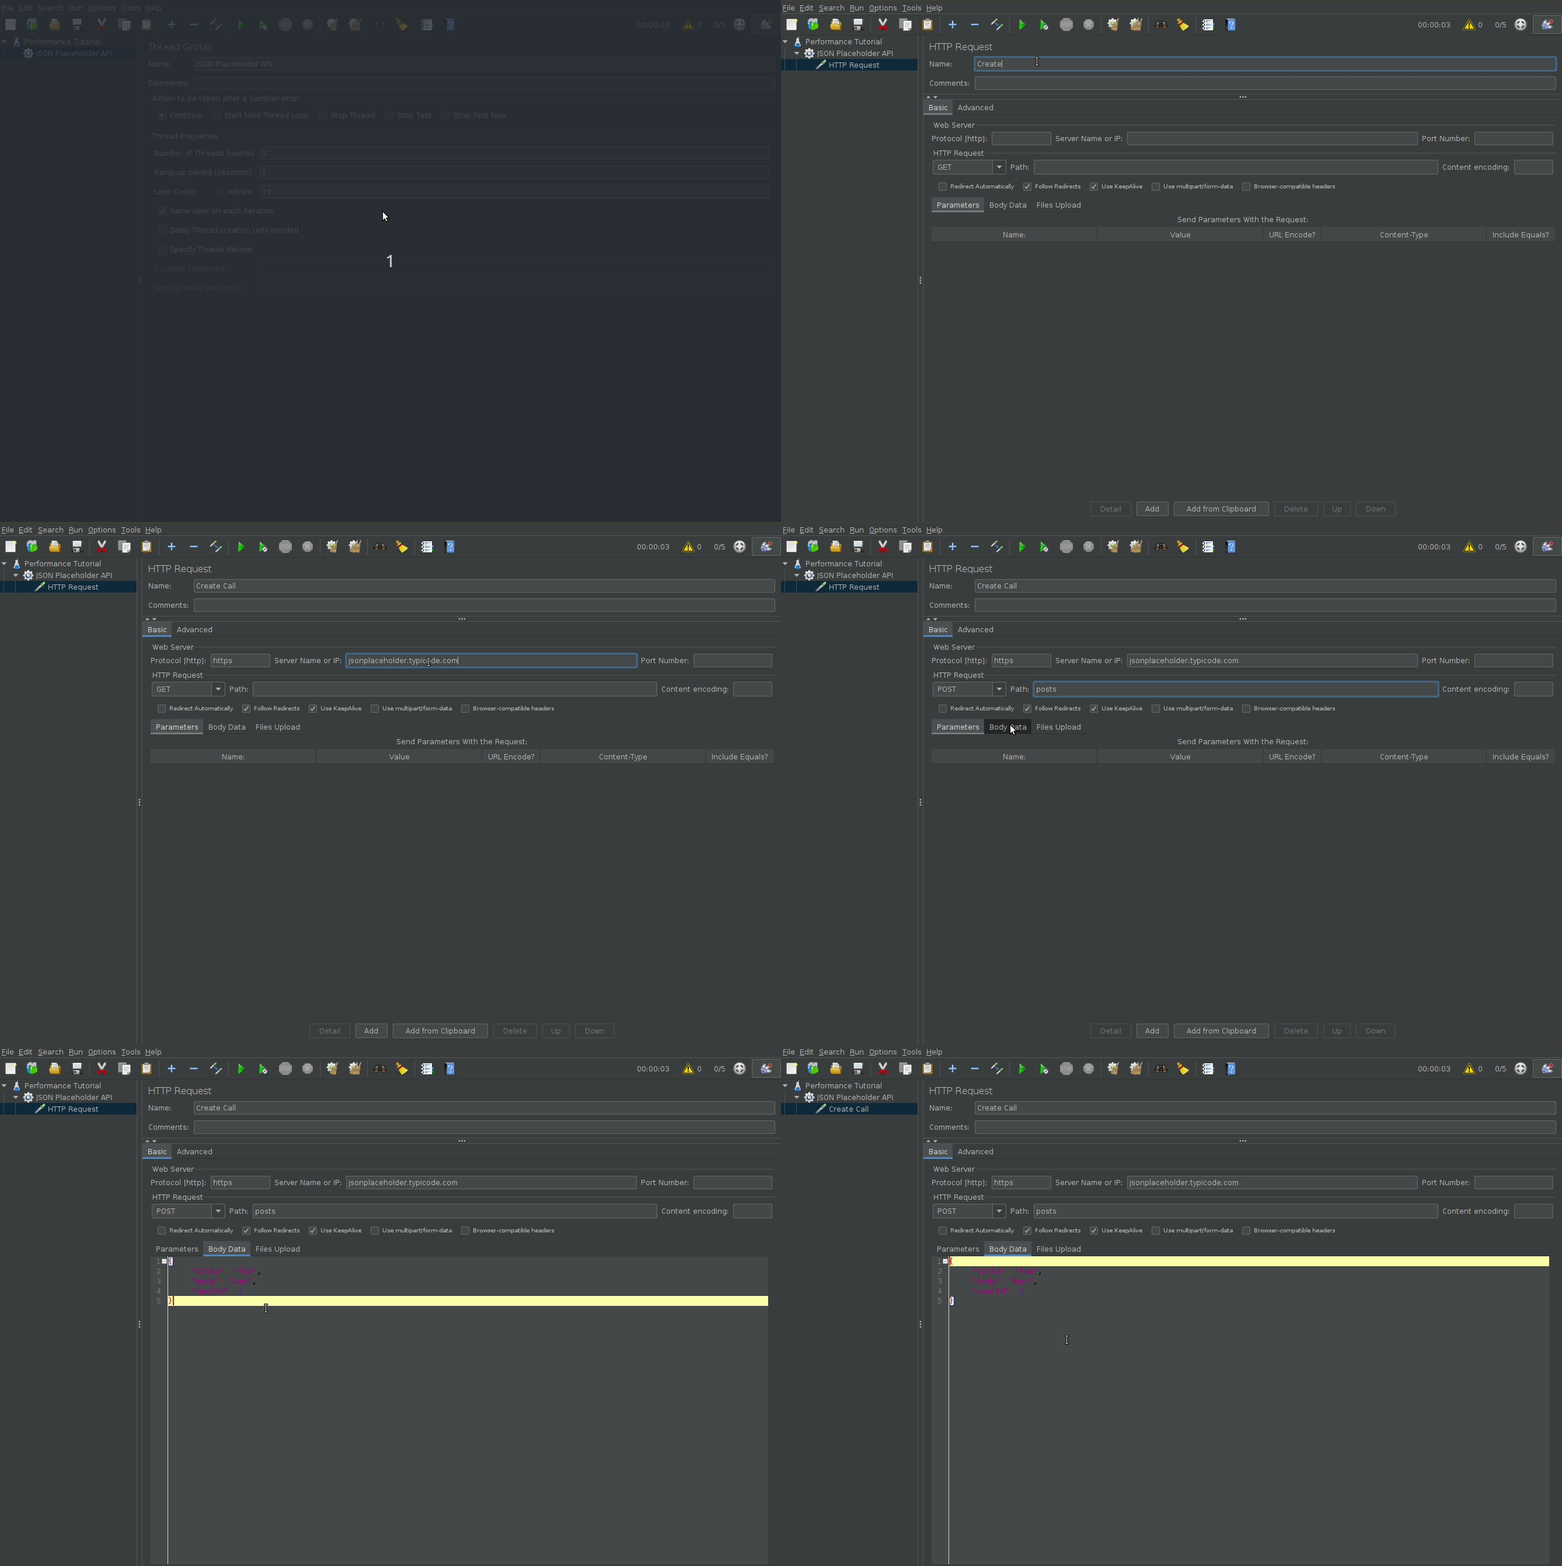
We will be using the json place holder api to do HTTP performance testing by sending simple POST requests. The same principles can be applied to your actual api.
Add HTTP headers
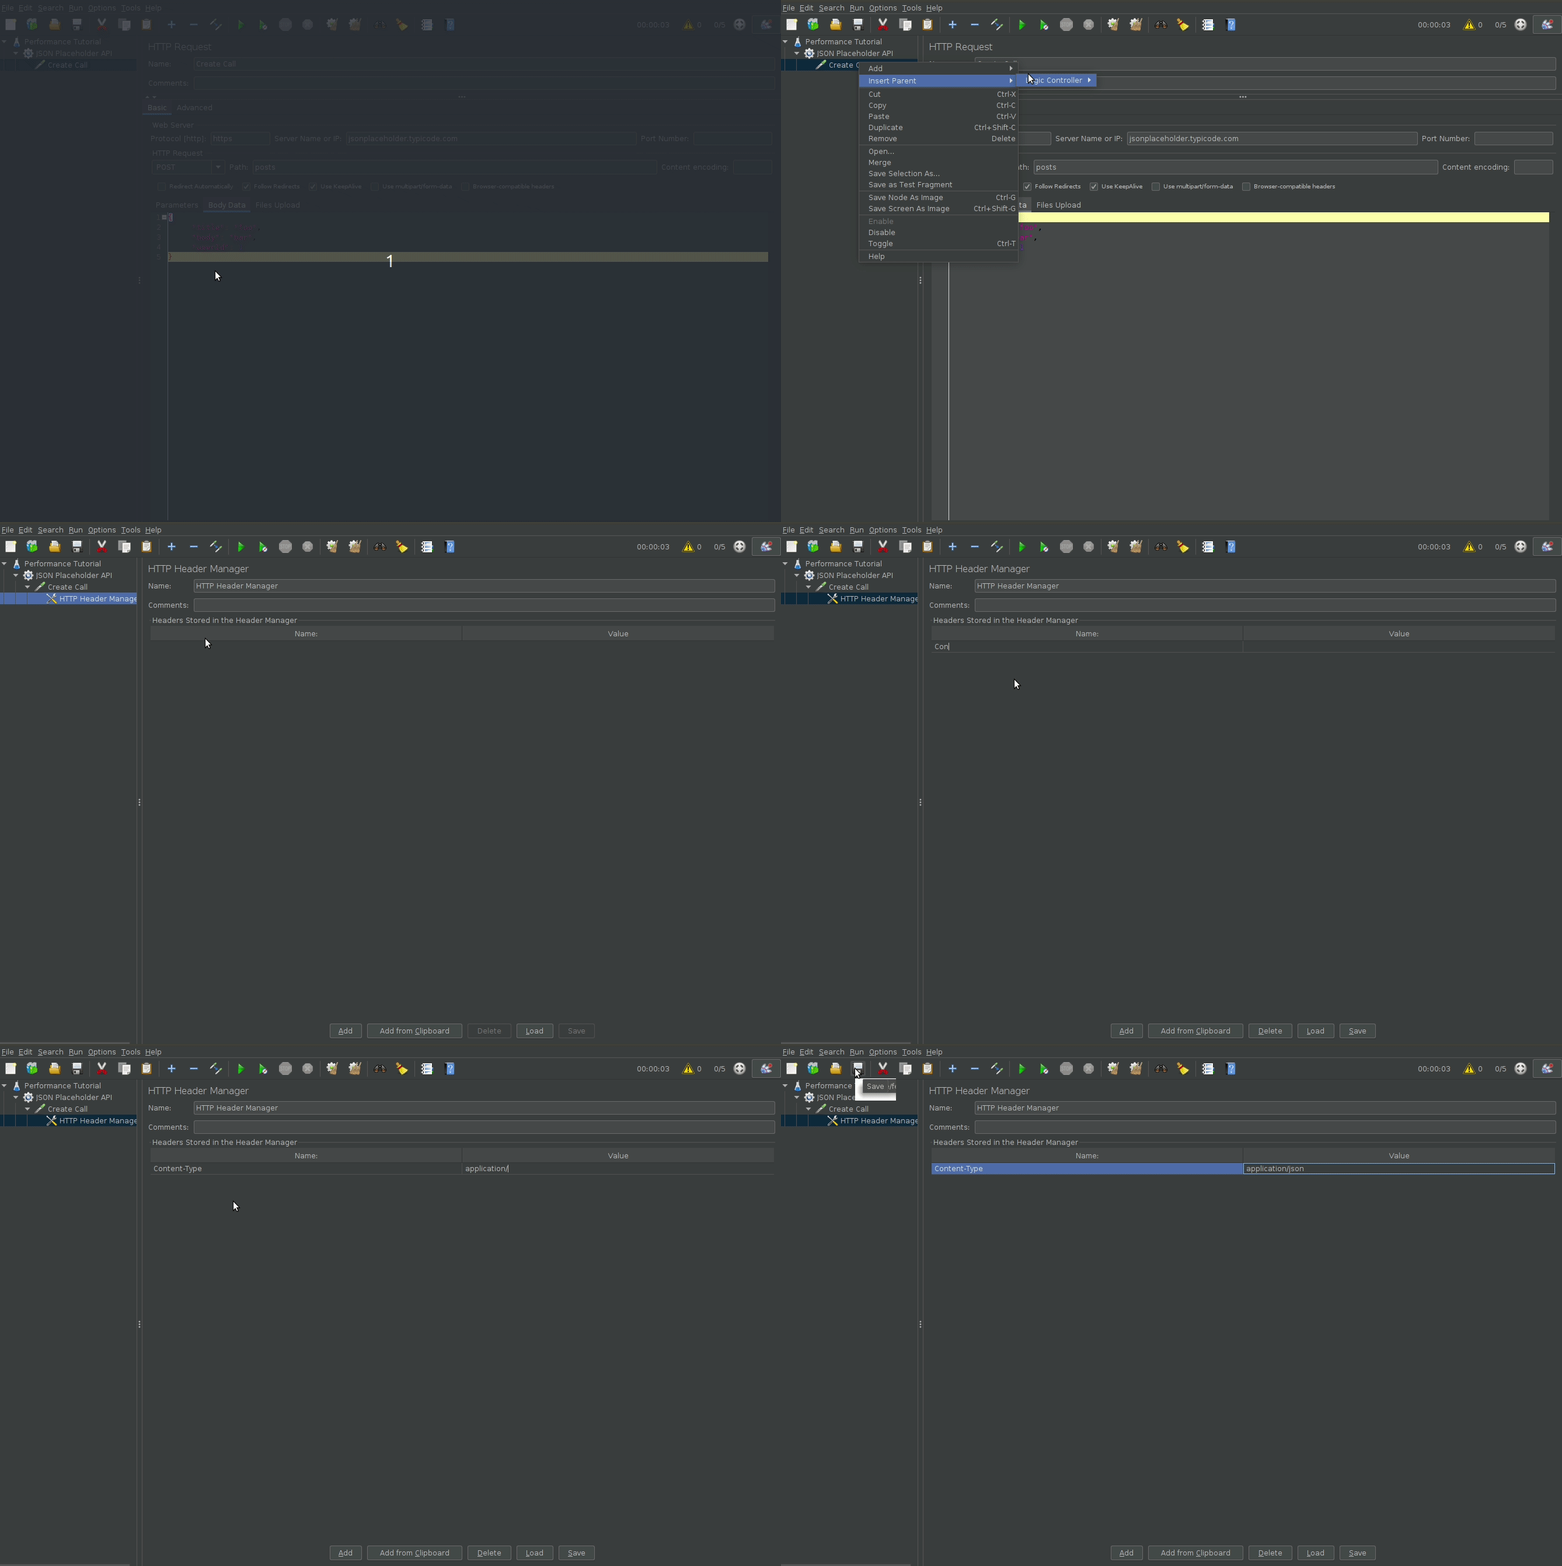
To customize http request headers, add a HTTP Manager block.
Configure Displaying and Saving results
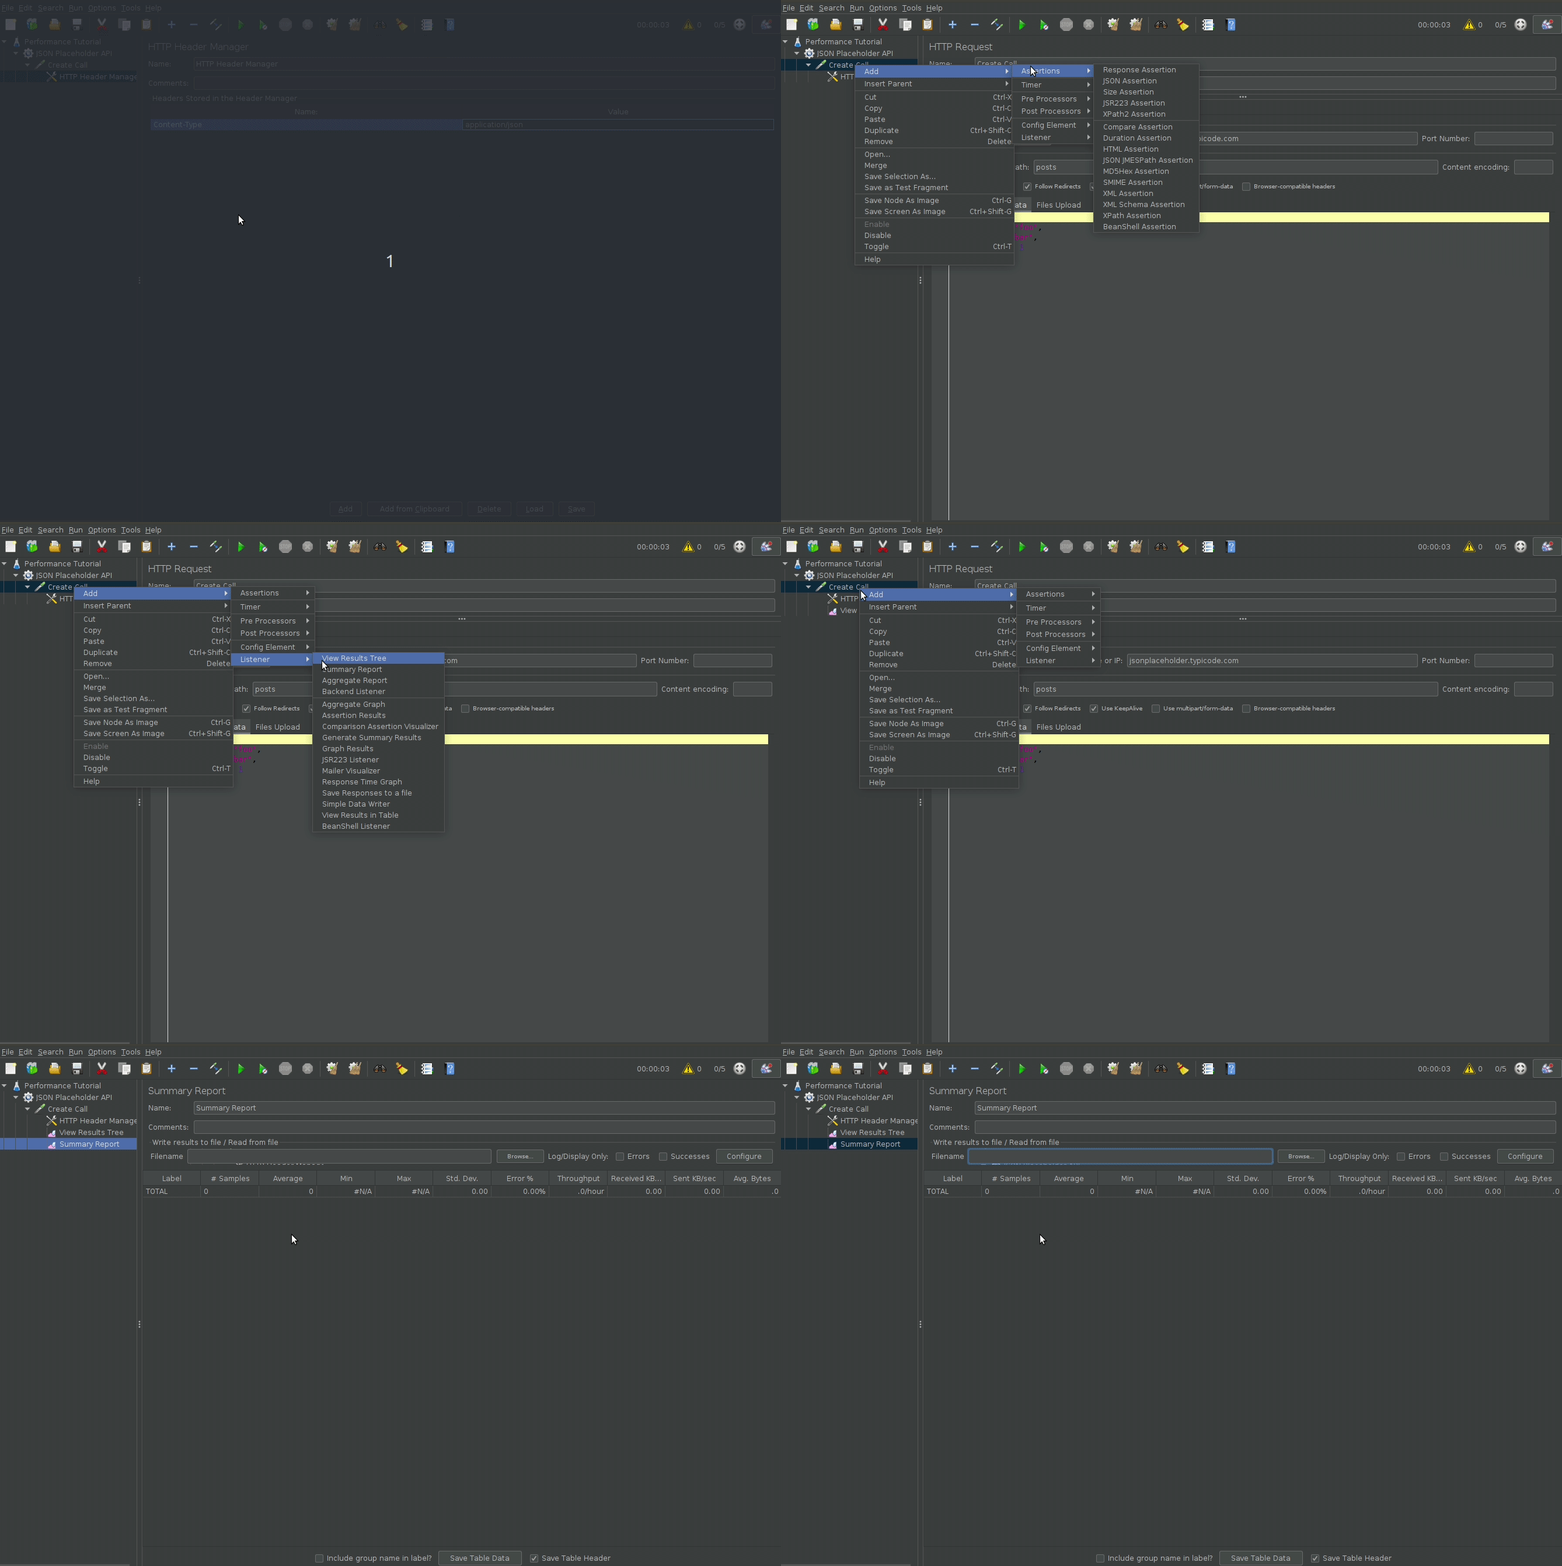
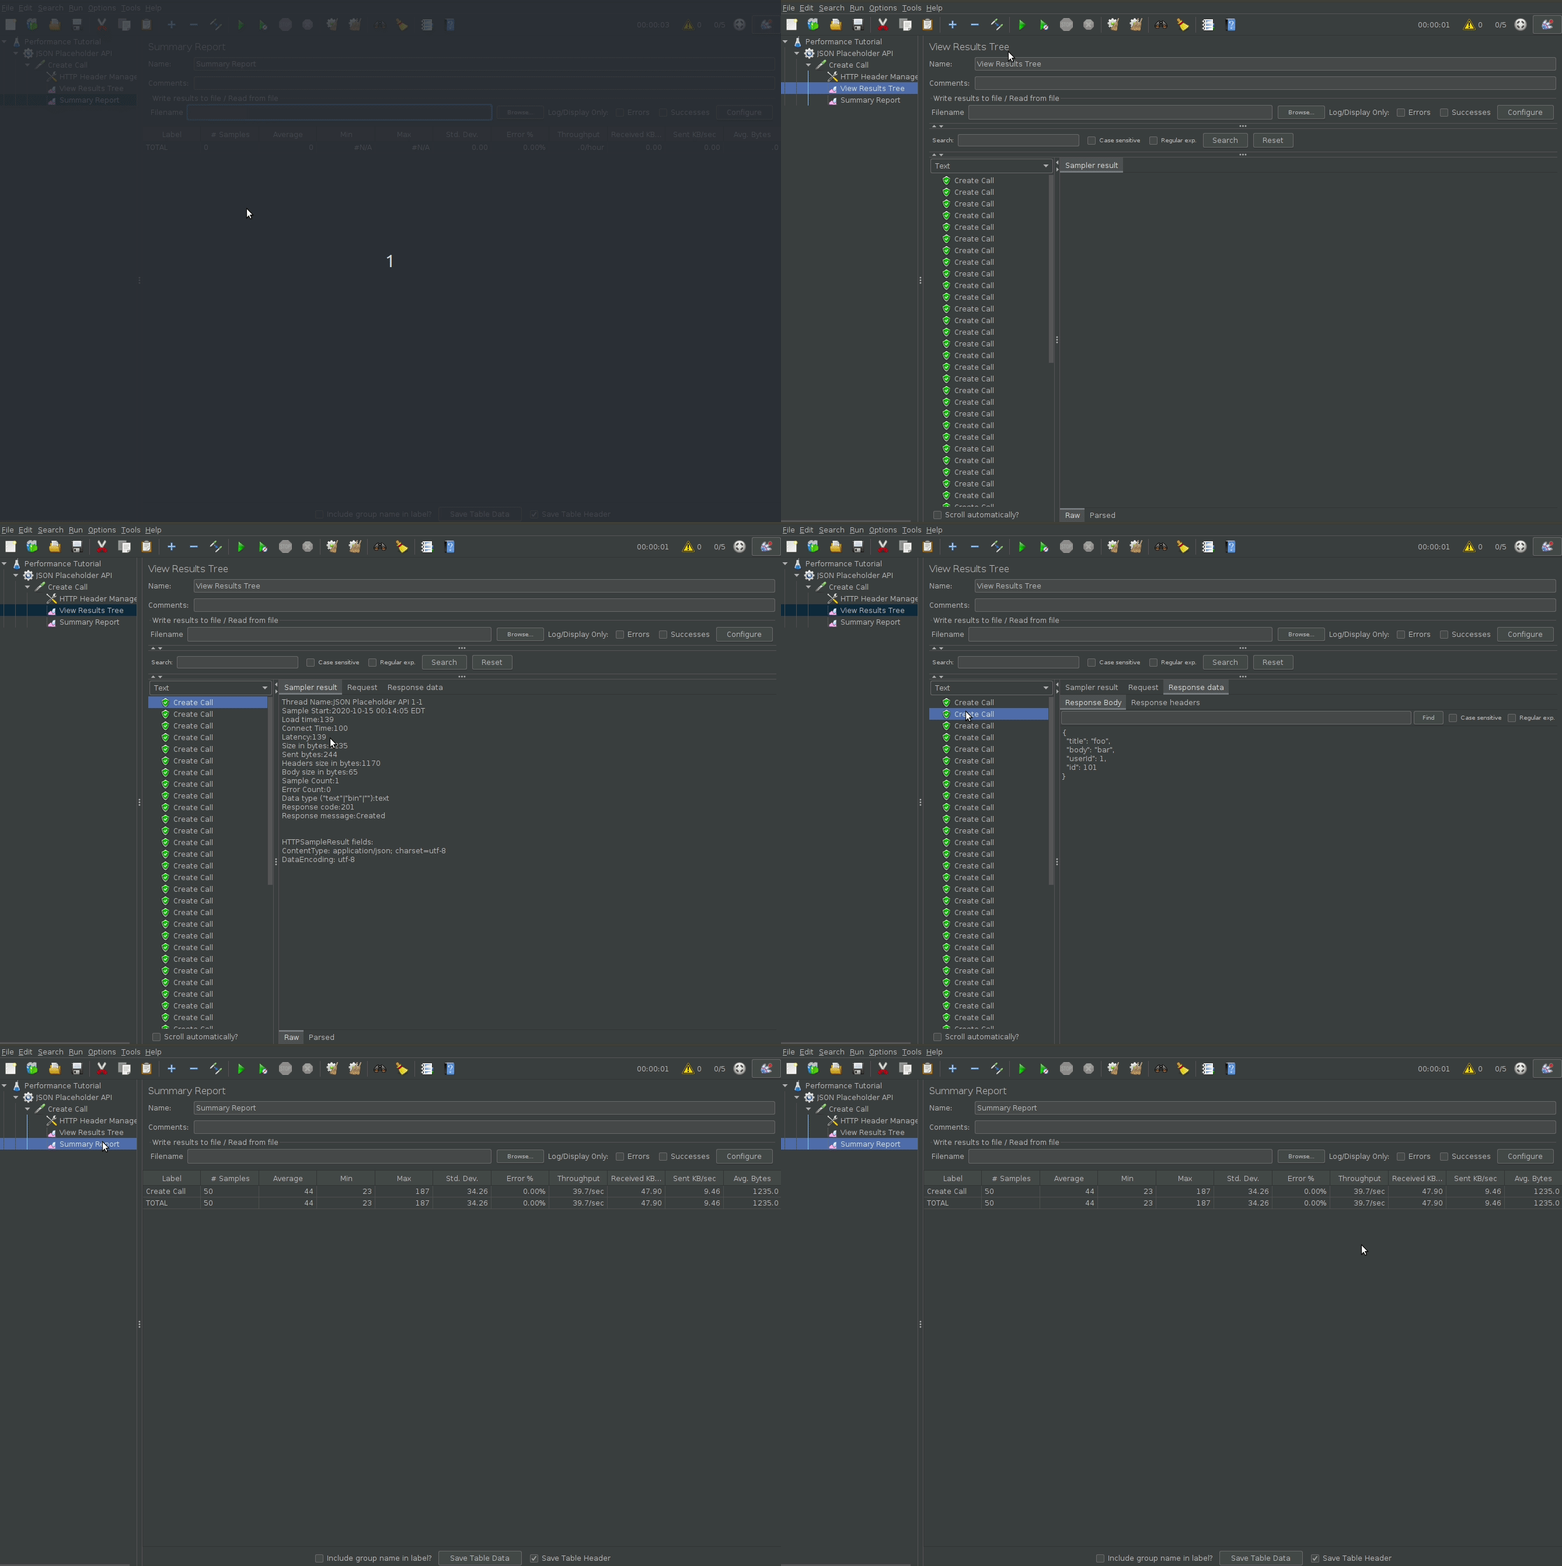
By default, jmeter does not show the performance test results (passes, failures, response times). To do so add the View Results Tree listener to see the api calls, and the Summary Report listener to get a summary of response times, successes and etc.
Configure Test Duration
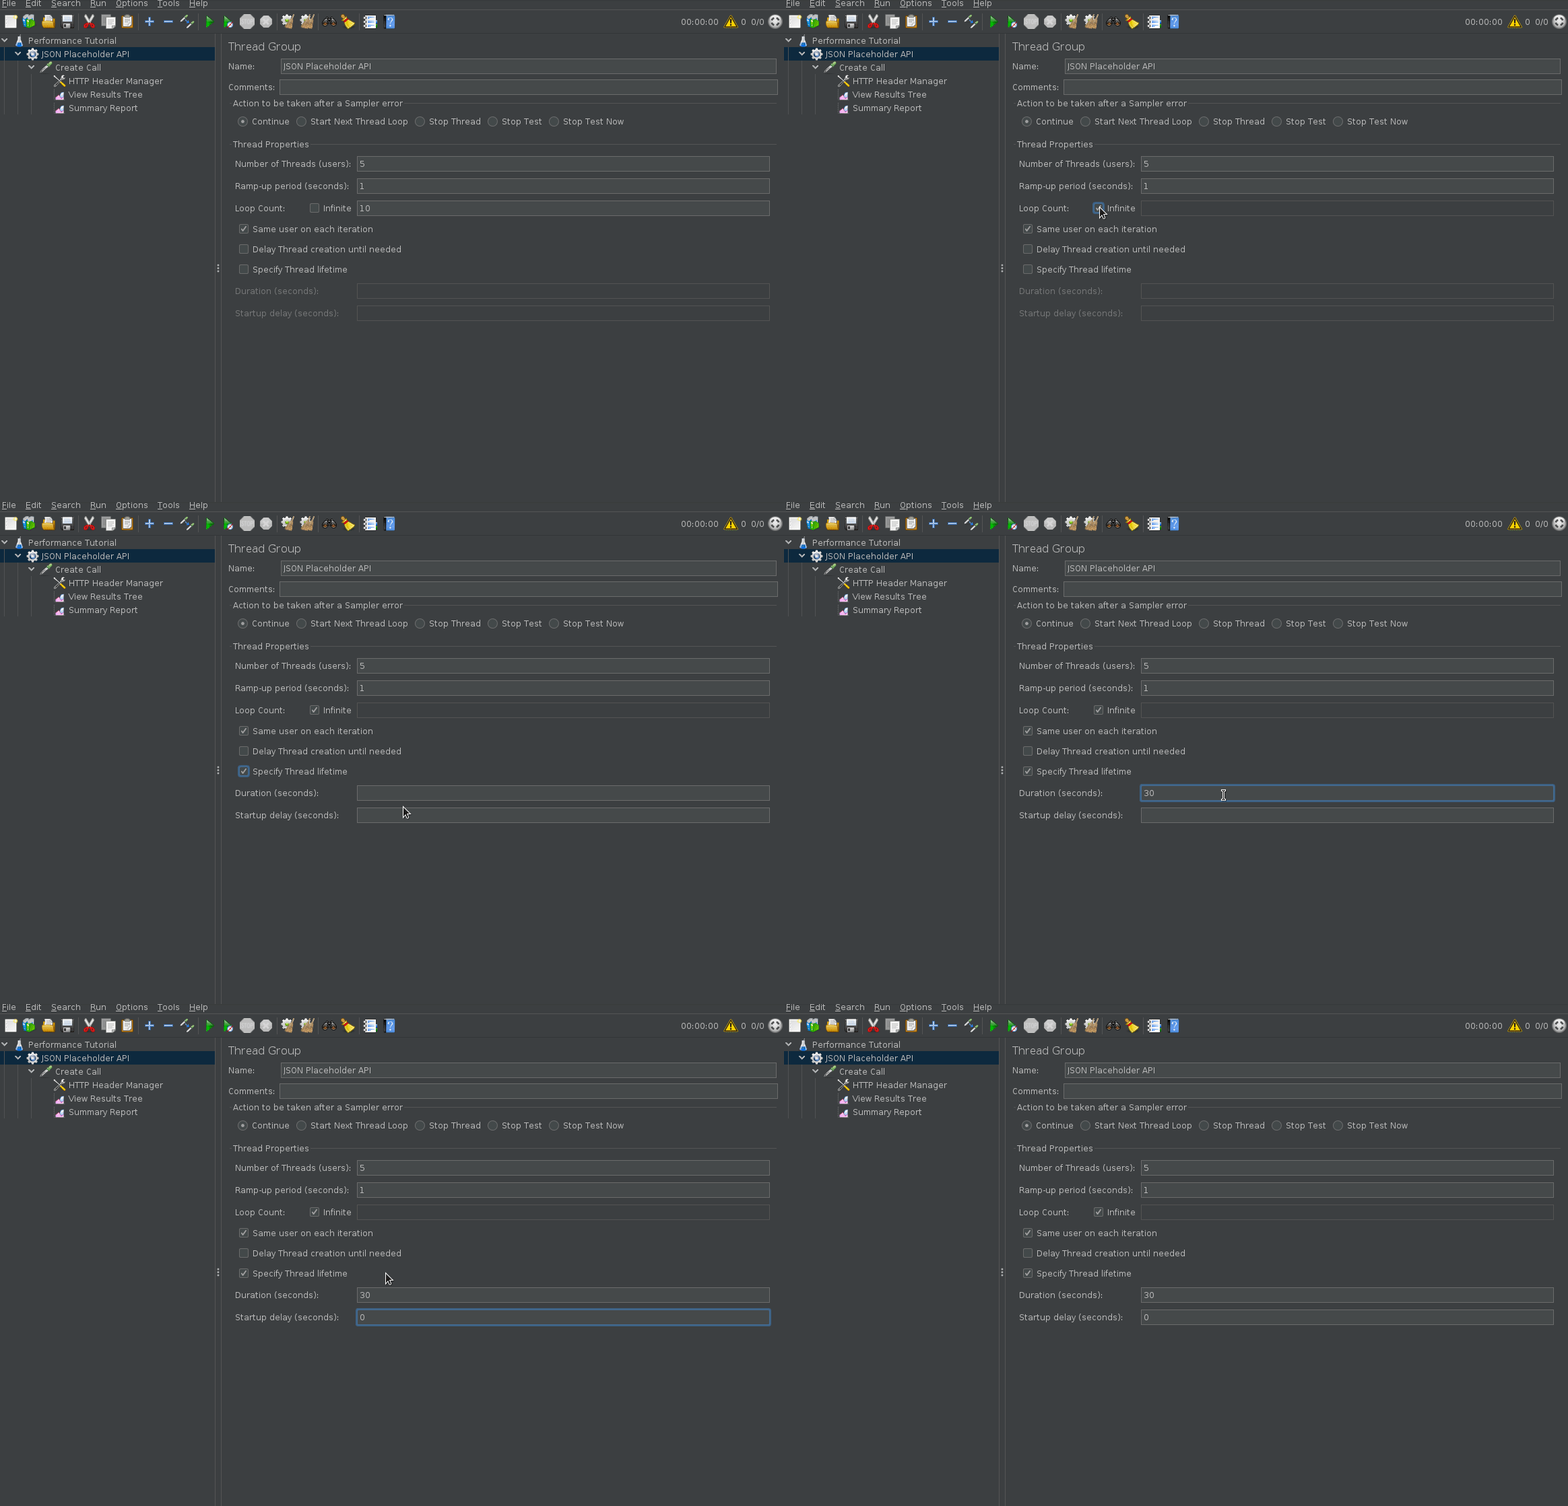
By default, if you execute your Jmeter script it will continue executing forever until you stop it. You can define the test duration by using “specify thread lifetime”. Alternatively, you can also define a number of iterations the test should run as opposed to time.
Configure TPS
To configure a certain TPS (throughput per second), you can add a constant throughout timer. The constant throughput timer is defined in TPM (throughput per minute) so simply multiply your TPS by 60 to get your desired TPM.
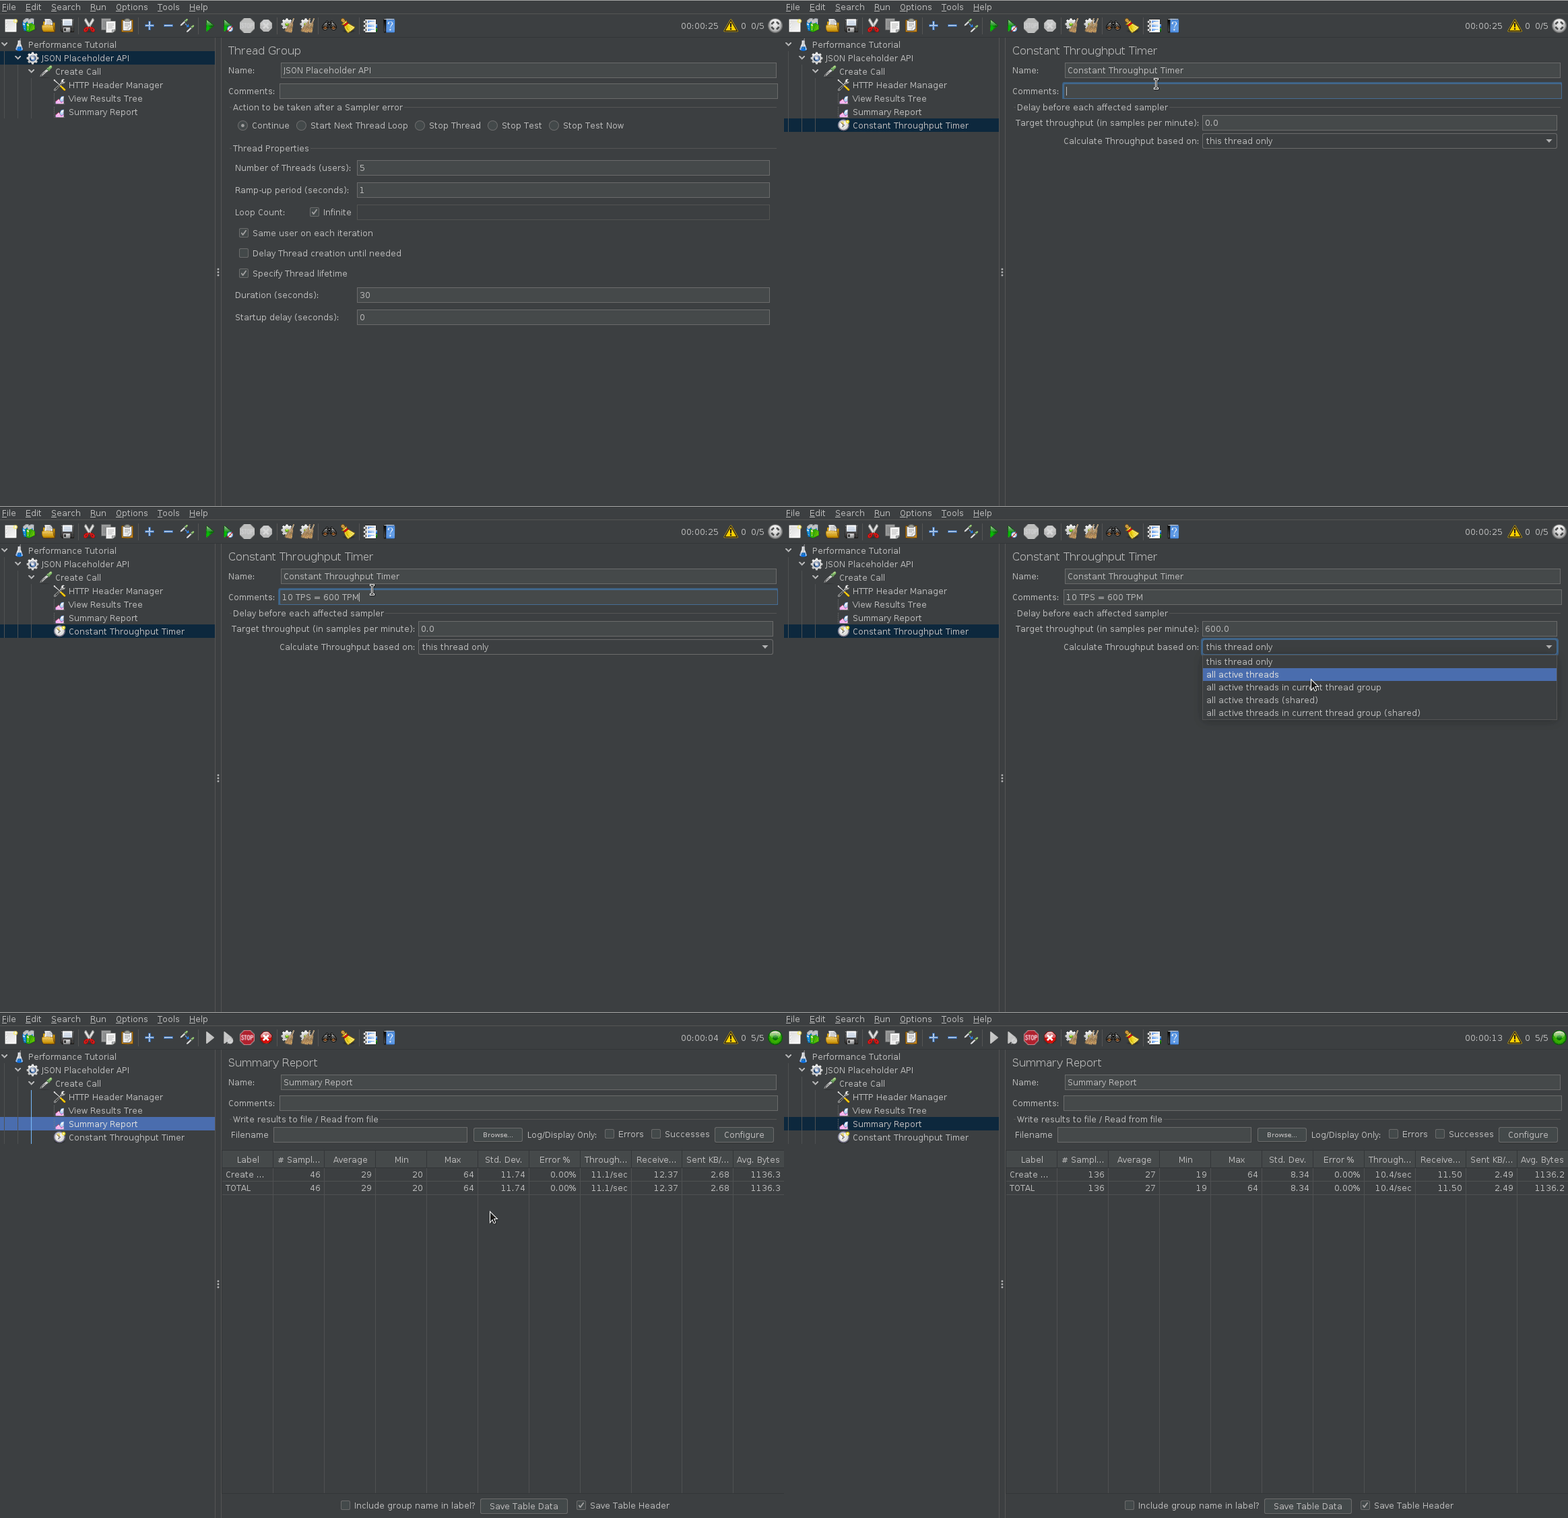
If you desire a dynamic TPS throughout your test you can use a throughput shaping timer.
Run the Script
To run the script, simply click the green play button, wait, and view the results.
Misc
Running Jmeter With Proxy
To run Jmeter with proxy, pass it in during the jmeter command as shown below.
jmeter -H <proxy-host> -P <proxy-port> -u <username> -a <password> -N <no-proxies>
An example that uses an unauthenicated proxy would look like so
jmeter -H myproxy.com -P 1111
You should also be able to configure the proxy through the Jmeter UI.